研究如何使用 AWS 的 CloudWatch 來收集 EKS 的 log. 並使用 Grafana 做 log search.
原本的 logging architecture 是使用 Elasticsearch + Filebeat + Kibana; 現在改用 AWS CloudWatch + Fluent Bit + Grafana.
問題描述
原架構為 Elasticsearch + Filebeat + Kibana, 基於下述狀況決定改架構, 來減少維護成本.
- 目前開發使用情境, 之需要查看 log 且可以搜尋, 不需要做資料探勘. 殺雞用牛刀了.
- Elasticsearch 在 Basic License 下, 無法使用 LDAP, PKI3, Active Directory authentication 功能.
- Elasticsearch 硬體需求較高, 最低的硬體需求為 t2.large (2 vCPU, 8 Mem).
- Elasticsearch 使用門檻較高, 能維護的人員不多, 維護上困難.
日誌蒐集狀況
Index lifecycle Management 配置
取 kubernetes 的 ilm 配置, 看到熱資料配置為 20gb or 15d 做 rollover.
elasticsearch:/opt$ curl -XGET --user "$account:$password"  "http://$host/_ilm/policy/kubernetes?pretty"|jq
{
  "kubernetes" : {
    "version" : 23,
    "modified_date" : "2021-07-07T07:58:49.033Z",
    "policy" : {
      "phases" : {
        ..................
        "hot" : {
          "min_age" : "0ms",
          "actions" : {
            "rollover" : {
              "max_primary_shard_size" : "20gb",
              "max_age" : "15d"
            },
            "forcemerge" : {
              "max_num_segments" : 1
            },
            "readonly" : { },
            "shrink" : {
              "number_of_shards" : 1
            },
            "set_priority" : {
              "priority" : 100
            }
          }
        },
      }
    },
    ..................
  }
}
資料使用量
目前資料使用量為 167G (./elasticsearch/data).
取其中一個 site 的 production 環境資料,平均 index 約 9.62 GB.
curl -XGET --user "$account:$password"  "http://$host/_cat/indices/*prod*?v=true&pretty&s=index"

health status index                                     uuid                   pri rep docs.count docs.deleted store.size pri.store.size
green  open   kubernetes-prod-000039             co5bX1YqSOu11BaKVkUnKw   2   0   10075181            0      6.5gb          6.5gb
green  open   shrink-arvp-kubernetes-prod-000036 tgcGQwEZSliq9H2R4QJDCQ   1   0   16602612            0       10gb           10gb
green  open   shrink-kvlp-kubernetes-prod-000038 g0if66MHTDmyWm4vcuX9cw   1   0   15674075            0      9.7gb          9.7gb
green  open   shrink-laqk-kubernetes-prod-000035 FxLNQzpjQRKjsz_H8Vkl5w   1   0   20661224            0     12.7gb         12.7gb
green  open   shrink-ttkl-kubernetes-prod-000037 DpeVcQVgTg-VKfOykWkN3Q   1   0   15092948            0      9.2gb          9.2gb
執行
照著 AWS 教學文件 Set up Fluent Bit as a DaemonSet to send logs to CloudWatch Logs 實作.
Create AWS CloudWatch Logs
首先需要建立 AWS CloudWatch 的 Log groups for log stream. 其中 Cluster_Name 為 EKS cluster 名稱.
- /aws/containerinsights/
Cluster_Name/application - /aws/containerinsights/
Cluster_Name/host - /aws/containerinsights/
Cluster_Name/dataplane
在這邊使用 Terraform aws_cloudwatch_log_group 來實作.
Quick Start setup for Container Insights on Amazon EKS and Kubernetes
配置 IAM 權限. EKS 的 Node IAM role 需含下面權限
data "aws_iam_policy_document" "eks_node_group_cloudwatch_role" {
  statement {
    actions = [
      "logs:CreateLogStream",
      "logs:CreateLogGroup",
      "logs:DescribeLogStreams",
      "logs:PutLogEvents"
    ]

    effect = "Allow"

    resources = [
      "*",
    ]
  }
}
接著按照文件 Quick Start setup for Container Insights on Amazon EKS and Kubernetes 安裝 DaemonSet of Fluent Bit.
建立 kubernetes namespace
kubectl apply -f https://raw.githubusercontent.com/aws-samples/amazon-cloudwatch-container-insights/latest/k8s-deployment-manifest-templates/deployment-mode/daemonset/container-insights-monitoring/cloudwatch-namespace.yaml
執行 fluent-bit.yaml
ClusterName=production
RegionName=us-east-1
FluentBitHttpPort='2020'
FluentBitReadFromHead='Off'
[[ ${FluentBitReadFromHead} = 'On' ]] && FluentBitReadFromTail='Off'|| FluentBitReadFromTail='On'
[[ -z ${FluentBitHttpPort} ]] && FluentBitHttpServer='Off' || FluentBitHttpServer='On'

curl https://raw.githubusercontent.com/aws-samples/amazon-cloudwatch-container-insights/latest/k8s-deployment-manifest-templates/deployment-mode/daemonset/container-insights-monitoring/quickstart/cwagent-fluent-bit-quickstart.yaml | sed 's/{{cluster_name}}/'${ClusterName}'/;s/{{region_name}}/'${RegionName}'/;s/{{http_server_toggle}}/"'${FluentBitHttpServer}'"/;s/{{http_server_port}}/"'${FluentBitHttpPort}'"/;s/{{read_from_head}}/"'${FluentBitReadFromHead}'"/;s/{{read_from_tail}}/"'${FluentBitReadFromTail}'"/' | kubectl apply -f -
調整 application-log.conf
由於有做 healthcheck, 所以在 log 希望可以過濾掉 healthcheck 的資料.
需要再 application-log.conf 中加入下面資訊
[FILTER]
    Name                grep
    Match               application.*
    Exclude             log /.*healthcheck.*/
kubectl edit configmap/fluent-bit-config -n amazon-cloudwatch
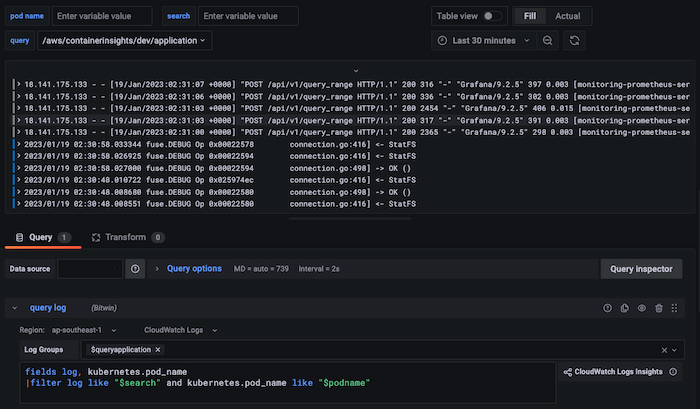
使用 Grafana 做 Dashborad
帳戶管理 LDAP
上面提到痛點之一就是帳戶無法統一管理, 容易遺漏. 這邊 Grafana 原生就提供 LDAP 的功能.
確認 LDAP 功能有 enable, 在 /usr/share/grafana/conf/defaults.ini.
這邊以 image: grafana/grafana:8.3.1 為例, 編輯 /usr/share/grafana/conf/ldap.toml 檔案.
[[servers]]
host = "ldap.example.com"
port = 389
use_ssl = false
start_tls = false
ssl_skip_verify = false
bind_dn = "uid=uid,cn=users,cn=accounts,dc=example,dc=com"
bind_password = 'passowrd'
search_filter = "(uid=%s)"
search_base_dns = ["cn=users,cn=accounts,dc=example,dc=com"]
[servers.attributes]
name = "givenName"
surname = "sn"
username = "uid"
member_of = "memberOf"
email =  "email"

[[servers.group_mappings]]
group_dn = "cn=admins,cn=groups,cn=accounts,dc=example,dc=com"
org_role = "Admin"

[[servers.group_mappings]]
group_dn = "cn=groups,ou=accounts,dc=example,dc=com"
org_role = "Editor"

[[servers.group_mappings]]
group_dn = "*"
org_role = "Viewer"
Create Data Source
進到 Grafana 中的 Data Source, 加入 CloudWatch 源.
完成效果
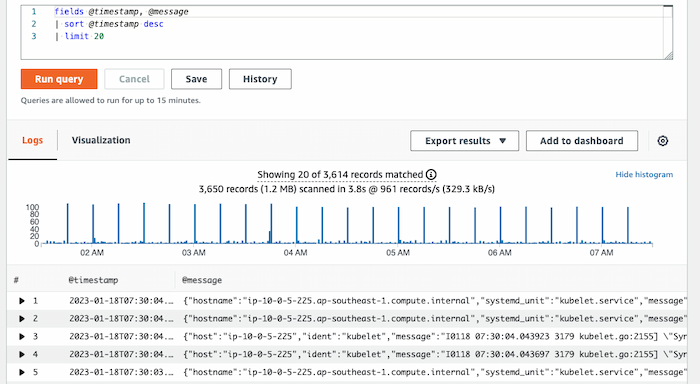
完成後會在 AWS CloudWatch 的 log groups 有接收到 log streams.
在 Grafana 中建立 Dashboard.
結論
上面提到的問題, 改了架構後做觀察.
目前開發使用情境, 之需要查看 log 且可以搜尋, 不需要做 log 分析..
這邊換了架構對開發並無影響. (開發沒過多反應, 平時有在使用嗎?)
Elasticsearch 在 Basic License 下, 無法使用 LDAP, PKI3, Active Directory authentication 功能.
這邊改用 Grafana 的 LDAP 功能做改善, 帳密的管理統一, 維護上變簡單.
Elasticsearch 硬體需求較高, 為 t2.large (2 vCPU, 8 Mem).
原本 t2.large, 使用 AWS 計算機算出的費用約 108.96 USD/Monthly cost 更改 CloudWatch, 收到的費用為 108.96 USD/Monthly cost (這邊為所有 groups 的費用, 包括 application, EKS, RDS 等)
這邊比較尷尬, 由於兩邊收集的 log 量不同, 不容易比較.
Elasticsearch 能維護的人員不多, 維護上困難.
在寫這篇文章的同時, 也看到一些新的 index 配置並無做優化. 相關配置也已經被動到. 很難受. 改新架構後維護應該要變簡單, 因為不用去搞 index 跟 ilm.